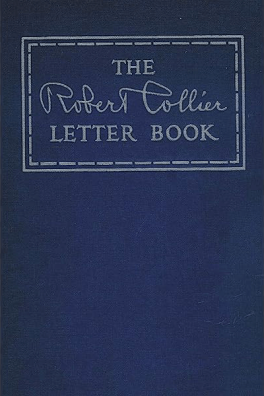
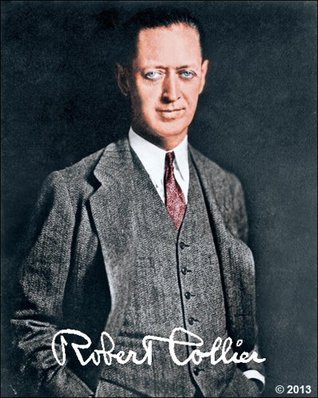
Get inspiration from the analysis of Robert Collier Letter Book’s Ad Performance.
Ads ran on 14.08-21.08.23
Started writing this analysis at 04.09.23
Get 1 or more leads during one week after launching the ad – Not reached.
Facebook Ad
I’m having trouble finding the clicks to reproduce metric, which appeared in other ads. So I contacted Facebook and am waiting for a resolution.
PPC Search Ad
I’ve got 0 impressions on the ad once again(happened a few times previously).
Even though I don’t think I changed anything since the last ad, which worked great. So I contacted Google Support to help me figure this out. Awaiting response.
YouTube Ad Analysis
Here are the results of the YouTube ad, in comparison to the last 3 YouTube ads.
METRIC | YOUTILITY | CONTENT INC. | CONTENT RULES | COLLIER |
Budget | 10$~ | 20$~ | 10$~ | 10$~ |
Impressions | 52,640 | 114,458 | 50,480 | 53,243 |
Views | 1,026 | 2,477 | 995 | 1,164 |
Likes | 13 | 39 | 18 | 11 |
CTR | 1.94% | 2.16% | 1.97% | 2,26% |
View-to-like ratio | 1.26% | 1.57% | 1.8% | 0.91% |
Average View Duration (During ad activity period) | 0:30 (06-13 May) | 0:30 (14-29 Apr) | 0:32 (16-23 Jan) | 0:35 (14-21 Aug) |
What Does This Table Mean?
Initial Assumption
From the results of this ad, it initially appears that the content itself is lacking something, not the packaging- which is the thumbnail headline and subhead – The things you see before you click.
That is because:
A) Its CTR is higher than the other 3 – Indicating that the ad(packaging) performed well.
B) Its likes are lower than the other 3 – Indicating that after attracting the viewers, the content didn’t satisfy them.
Eliminating One Possible Cause - Testing That The Data Is Paid Only
I wasn´t sure that the likes of the other ads were measured strictly in the ad period and not a week of organic period too, so I double checked myself. The test is Illustrated in the table below in the parenthesis. If there´s a deviation from the original number, it is presented there.
METRIC | YOUTILITY | CONTENT INC. | CONTENT RULES | COLLIER |
Budget | 10$~ | 20$~ | 10$~ | 10$~ |
Impressions | 52,640 (Ad Google) | 114,458(Ad Google~80) | 50,480 (Ad Google) | 53,243(Ad Google) |
Views | 1,026 (Ad Google) | 2,477 (Ad Google) | 995(Ad Google) | 1,164 (Ad Google) |
Likes | 13(upload day- end of ad meaning +3 days before beginning of ad) | 39 (Now 37) | 18 (YouTube Analyrics) | 11 (YouTube Analytics) |
CTR | 1.94% | 2.16% | 1.97% | 2,26% |
View-to-like ratio | 1.26% | 1.57% | 1.8% | 0.91% |
Average View Duration (During ad activity period) | 0:30 (06-13 May) | 0:30 (14-29 Apr) | 0:32 (16-23 Jan) | 0:35 (14-21 Aug) |
Test Result
Since the changes were minor, I decided not take them into account.
I think some people removing their likes, and minor adjustments in the google ad platform after the end of the ad might have been the cause.
Investigating Further
To further prove or contradict the Initial Assumption, I checked the 4 pieces’ retention and subscription rates.
Retention Rate
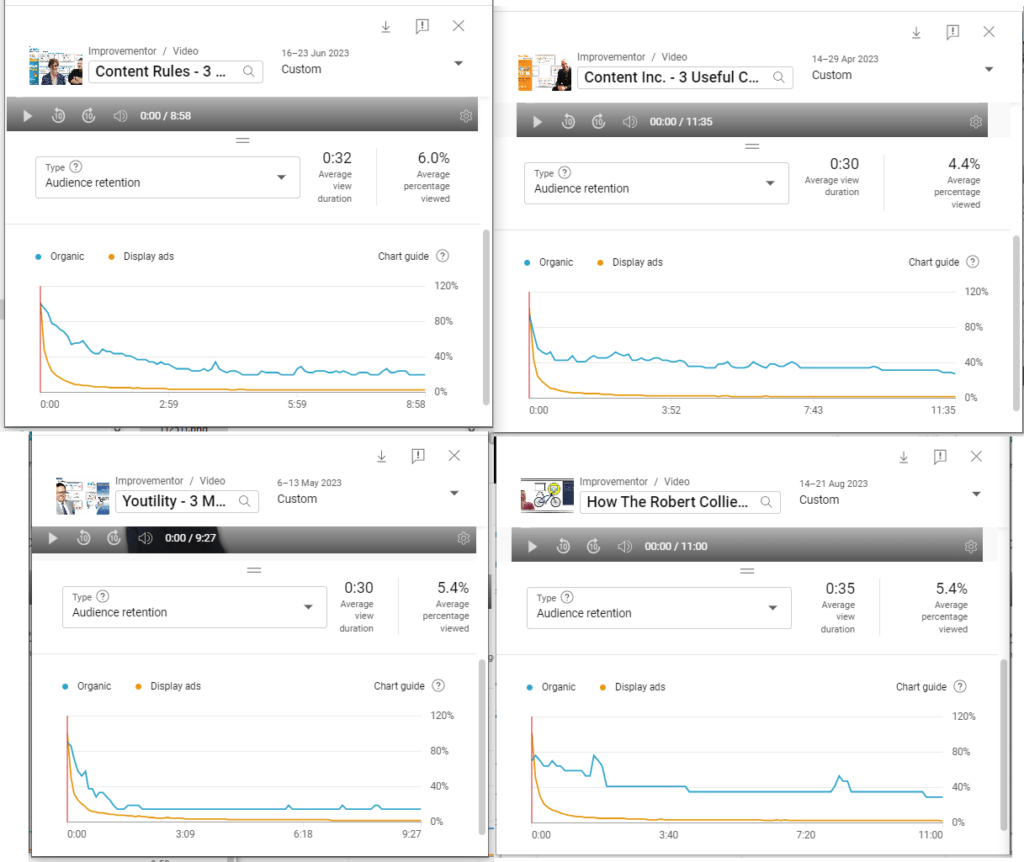
I found that both organic and paid viewership of Collier’s Book are either the same as the best performing video of the other 3 or better. (See the retention rate image below)
It was also longer than the other best performing videos, so when it has the same retention in percentage it’s actually longer. Which shows that it’s the video with the highest retention of the 4.
It therefore contradicts the initial assumption and shows that the content piece was interesting.
Subscription Rate
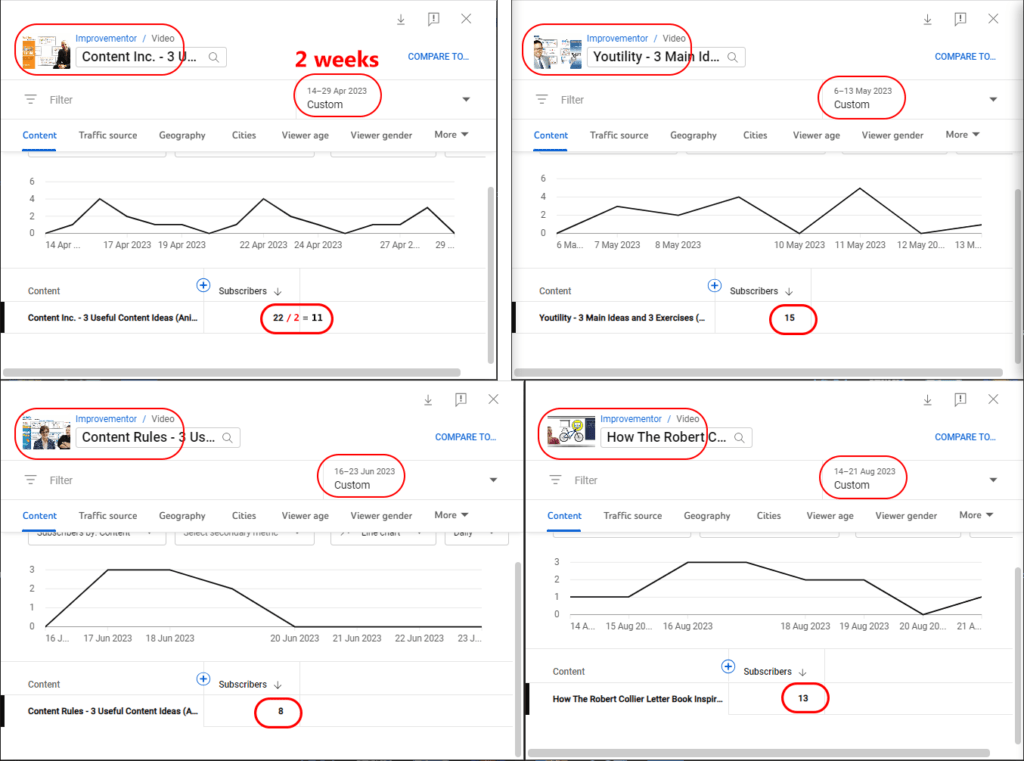
Collier’s Book was the second best in this metric too.
The results for the period when the ads ran were:
Youtility – 15
Content Inc. – 11
Content Rules – 8
Collier’s Book – 13
The Reason For The Low Likes
So what did cause the reduction in likes?
Since subscriber and retention metrics show a different picture than the likes, it could make sense that the cause is a standard deviation, meaning that if the ad was to run longer, it would likely even out.
I would have stopped there, but, I have recently been testing new headlines for this content piece and together with the new ads it ran longer than the other ads, and it showed that the view-to-like ratio got even lower (about 0.66%) so standard deviation was probably not the reason.
What then?
One more thing could be the cause.
Possibly a Difference in Audiences?
Bottom Line - What Is The Lesson?
It’s difficult to point the finger at exactly what caused Collier’s Book to get 0 leads and fail at the set lead goal of 1 lead. But, I have found a possible cause which is the difference in audiences.
To test this assumption, I’ll keep the same 5 audiences in the next few pieces unless something unexpected happens.
Related Articles
Example of Analyzing Results (Content Rules)
The ads generally ran from 16-06 to 23-06 give or take a day.Here are their results analysis after two and a half weeks – 05-07-23.
Measuring The Last Content Piece (Youtility)
A live example of analysis and improvement of a content cycle (Youtility). Could you do something similar? What was being tested? (One thing) Reverting to
Youtility Simple Summary and 3 Takeaways (Good Book)
A concise overview of the book that Joe Pulizzi suggests, and 3 Takeaways for Content Creators.Let´s see what Youtility by Jay Baer has to offer.


