Since the analysis was getting a bit too long I broke it into two. This part is for you, video creators :).
[(Facebook + Google) ads]
Main Goal: 1+ leads in each of the Video and Search ads, during the period they ran.
Results(Video Only):
Google Video Ad + YouTube Video – 798 Views + 3 Leads – Double Hurraaaay!!! (YouTube description forms only)
Facebook Video Ad + Video – Impressions 1080 + 0 Leads – Boo-hoo! (Facebook form CTA only)
Now lets see a few more illustrations and investigate what we could keep or improve in the video ads.
Google Video Ad - YouTube Results/Outcomes
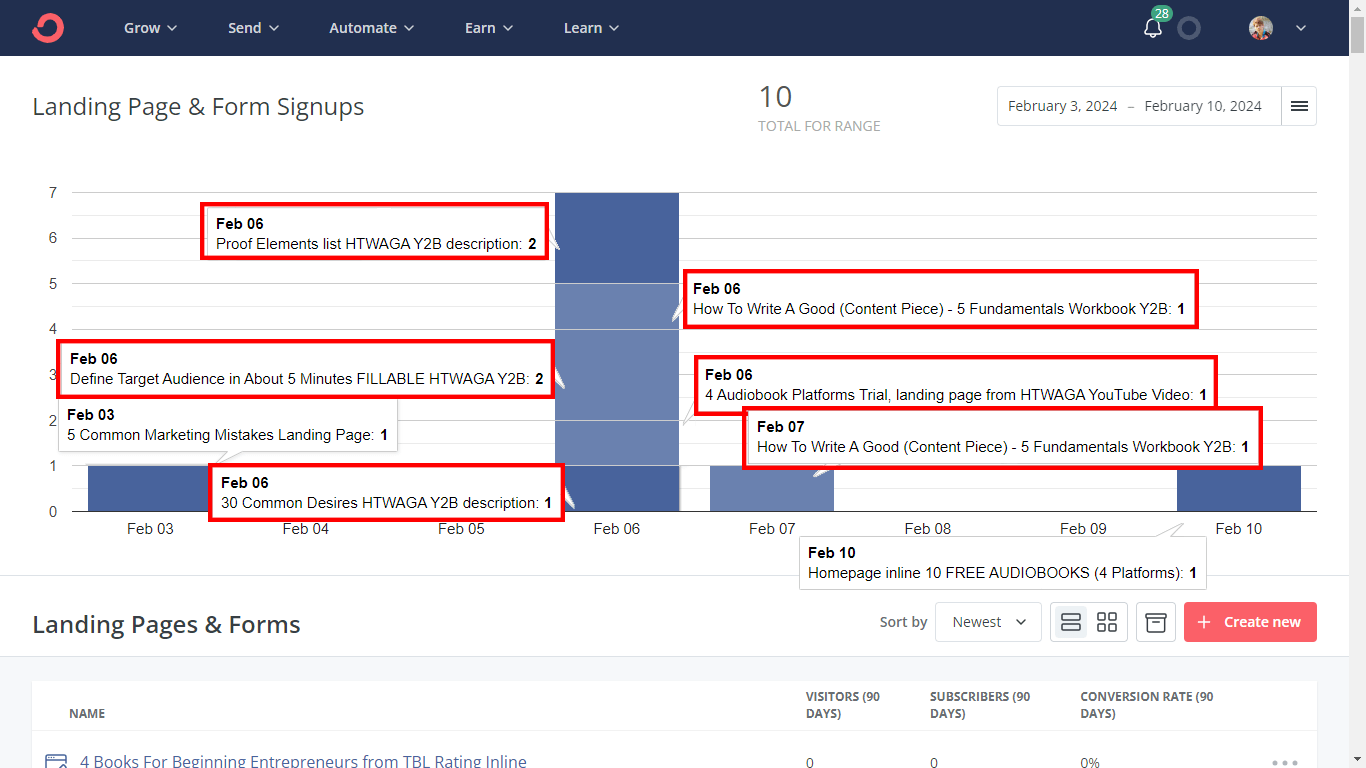
The above mentioned 3 Leads came from forms in the video description only as Highlighted in red squares in the image below.
This is because the other forms might have gotten leads from a different traffic source (Google PPC Ad/Organic/Facebook Ad). While the YouTube form leads are most likely from the YouTube ad.
The date range in the image is 3.02-10.02 because that’s when the ad ran.
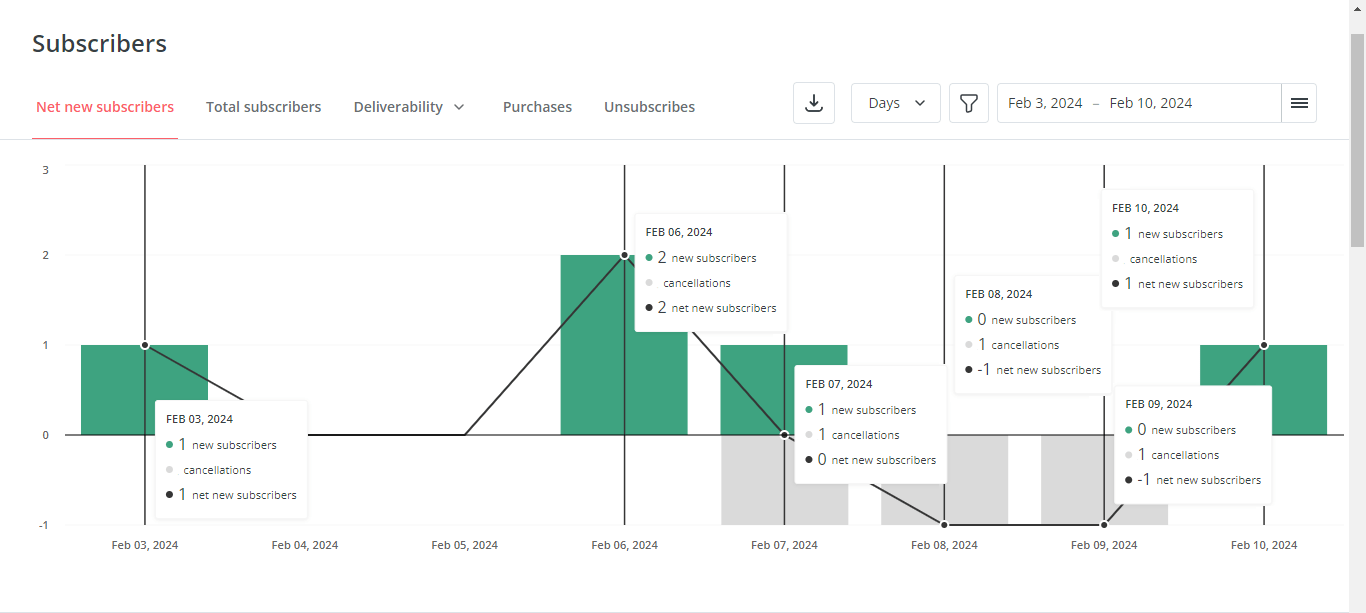
The 8 form visits in the screenshot above translated into 3 leads on Feb 6 and 7 as you can see below.
There were also 4 cancellations during this period out of which only 1 was also subscribed in the same period. I didn’t include her in the “3 Leads” count (ConvertKit doesn’t show her either as you can see on the screenshot below, there are only 3 on feb 7-9).
All this resulted from just 798 Views of the video ad as you can see in the table below along with some other metrics compared to TAM*
HTWAGA | TAM | |
Impressions | 31,165 | 38,905 |
Views | 798 | 1,075 |
Cost | 39.99₪ | 39.99₪ |
Avg. CPV | 0.05₪ | 0.04₪ |
View rate | 2.56% | 2.76% |
Settings/Inputs and how they might have affected the outcomes
Google YouTube Ad Inputs Comparison
Because the ad was “In-Feed” which requires you to click on it just as a regular video(Not popping in-stream), there are mostly 4 things that may affect your choice of whether to click it or not. They are Thumbnail, Heading, Subheading and Audience. In the below table you may see what they were in comparison to TAM.
HTWAGA | TAM | |
Heading A | How To Write A Good [Content Piece] Advertisement In 5 Simple Steps - Victor O. Schwab Book Summary | NOW For Content Creators - 4 Tested Advertising Methods of John Caples (Animated Summary) |
Heading B | How To Write A Good [Content Piece] In 5 Simple Steps | 4 Principles and ACTIONS for Content Improvement | Tested Advertising Methods |
Description(Both ad groups) | 1; HTWAGA Animated Summary | 1. Tested Advertising Methods Summary |
Thumbnail | ||
Audience | 10 best performing "places" | 10 best performing "places" |
Which could lower the CTR in HTWAGA?
Google YouTube Ad Conclusion
See if I may repeat the high CTR of TAM by using the same metrics as TAM.
Meaning:
1. Keep the description and audience as is
2. Change the heading and thumbnail to be the same as TAM´s and see what happens.
For example:
Heading B: [X] Principles and ACTIONS for Content Improvement | [Book Name].
Comparison of the Video itself (After Click)
Below are some differences inside the video that came to mind and might have affected the lead count, which, I remind you, turned out to be 3 out of 798 views
HTWAGA | TAM | |
Main CTA Prompts | End of Each Chapter | Conclusion only (1) |
PDF File Variety | Main + 3 Others (4) | Main only (1) |
Overall PDF Download Prompts | 11 | 1 |
Main CTA Type | Workbook | 10+ Free Audiobooks |
Video Making Software | PowToon | Doodly |
CTA Animation | Zoom In + Workbook Jumping | Simply on endscreen |
Video Conclusions to Apply in TBL
Try repeating all the metrics of the left column in the TBL video, apart for PowToon perhaps, that is because it costs about 90$ a month X_X
Then monitor and see if the results repeat themselves.
Facebook Video Ad Results (Outcome)
The ad flopped. Hurray! 🙂
So after previously using the very limited “Meta” ad interface, I recently started analyzing ads through the “Ads Manager”, which is the complete opposite and has a million metrics. Now after a lot of tinkering and understanding the different metrics I can surely tell the ad flopped. Which is great because now we may try improving it once again 🙂
It got just 1 Landing page visit.
So did the last ad of TAM. How did I not see this earlier? That’s because Meta only shows us the metrics that are predefined. And even after switching to Facebook Ads Manager there are still tons of confusing metrics. For example:
-Clicks (All)
-Clicks (Link)
–Destination Page Views
-Outbound Clicks, etc.
Thankfully – Jon Loomer Explained it in detail here and brought me some clarity.
For now I’ll say the metric I needed is Destination Page Views – The amount of people who clicked the link of our landing page and stayed long enough to have it loaded.
Below is a table with this and other metrics that are worth mentioning
HTWAGA | TAM | |
Cost | ~6.73$ (25.02₪) | 8.75$ |
Impressions | 1,080 | 3,040 |
Destination Page Visits | 1 | 1 |
Interaction rate | lower than 0.1% | lower than 0.1% |
Average Cost | ~6.73$ | 8.75$ |
Dates | 3-10 Feb 2024 | 14-21 Oct 2023 |
Objective | Traffic | Traffic |
As you can see: “Destination Page Visits” was “1” which means the whole ad brought just one landing page view. As a result there were 0 opt-in sign ups. And since opt-ins was our goal, it means the ad flopped.
Facebook Ad Inputs and Conclusions
Campaign level
-No differences found (Apart for Cost which was set in the campaign for TAM and in the ad group for HTWAGA)
Ad group level
HTWAGA | TAM | |
Cost | 4 ₪ (Daily) | 8.75$ (Total) |
Sub-Objective | Maximize Landing Page Visits | Maximize Link Clicks |
Audience Interests | 6 Identical + "Marketing" and "Sales" (Business and finance) | 6 Identical + "Content Marketing(Marketing)" and "United Kingdom" |
Audience Type | Advantage + | Not Advantage + |
Just as the Google PPC ad didn’t work (0 results) because of the “Maximise Conversions” setting and started working when i changed it to “Maximise Clicks” perhaps the same may be done with the FB ad. I should try a different objetive possibly “Engagement” instead of “Traffic” in the TBL ad.
I concluded Engagement is the only other option that fits my goals after checking out one of Jon Loomer’s blog posts. That is even though the Facebook ad did bring some results and not 0 like Google but I still want to make sure.
Facebook Video Performance Result
The metric which shows how well the video did is the view-to-lead ratio. If we trust Facebook’s metrics and not Google Analytics the landing page views received are 1 overall, which means the video basically did very very bad, not the ad. But because in the video example of YouTube it is not the case and it got 4 leads, I tend to think it is likely some problem with the ad. So I’d like to start with the above resolution, and not make more observations about the video separately for FB.
8 Open-Ended Thoughts For Next Analysis
*1. Google analytics shows Tam FB CTA’s got 5 visits, HTWAGA’s FB CTA 11 while FB itself shows just “1 Destination page view” in both ads – I sent an e-mail to ask Jon Loomer if he knows why that happened, meanwhile my best guess is that all those visits didn’t end up loading the page.
*2. I forgot to place links to other CTA’s of HTWAGA in its comments. Nonetheless when I did place them in TAM, none of them got clicked according to Google Analytics (Although not sure about main CTA which is included both as the redirect from the CTA button and in the description separately, but one may assume if none of the others got clicked, this one likely didn’t too)
*3. For some unknown reason there’s an additional ad and ad group in the HTWAGA FB Ad that didn’t launch and stayed a draft. Currently I didn’t find the reason it happened. I suppose I wanted to do an A/B test but for some reason didn’t click the publish ad button. But, I’m unsure of even that since after a few days of search + writing to support I didn’t locate how I may see the full headline of both the ad groups since the headlines are long and the preview shows only a part of them. The part it shows seems identical.
*4. By the way I initially thought the ad simply didn’t launch, and that I didn’t even pay for it, because of how confusing the interface of meta and the ads manager is. I only figured it did work after looking at the credit card statement. so don’t feel bad with yourself if you don’t get completely on top of Facebook Ads quickly.
*5. I found out I have two ads manager accounts. One has the HTWAGA ad(Improvementor), and the other has all the rest(Yan Raychuk)
*6. A most accurate way to test content effectiveness is by keeping the ad the same and changing 1 factor in the content each time. But for now for whatever reason, I’d like to simply test the content effectiveness by the view to lead ratio, although not as accurate it may still give a general sense of its effectiveness.
*7. The only reason I have the option to test performance of 3 ads and content pieces simultaneously is because each has a separate landing page with a form. So note that you make a separate one for each.
Bonus: Finding Your 5 Best Performing Audiences
If you’re doing paid advertising you may also find it interesting how I discovered the 5 most performing channels out of under 50 I was targeting in 4 ads, so that you can do the same in your own advertising. (PDF below) (Your numbers may vary)


